Analytics Overview
Comprehensive Analytics Tools on Nexa
Nexa provides comprehensive analytics tools to help you make informed trading decisions. Our analytics suite includes real-time price charts, transaction monitoring, holder analysis, and social sentiment tracking all in one place.
Our analytics features are designed to give you a complete view of any token's performance, market dynamics, and trading patterns. Whether you're analyzing potential investments or monitoring your current positions, Nexa's analytics tools provide the insights you need.
All analytics data is updated in real-time. Charts, metrics, and indicators refresh automatically to provide you with the most current market information.
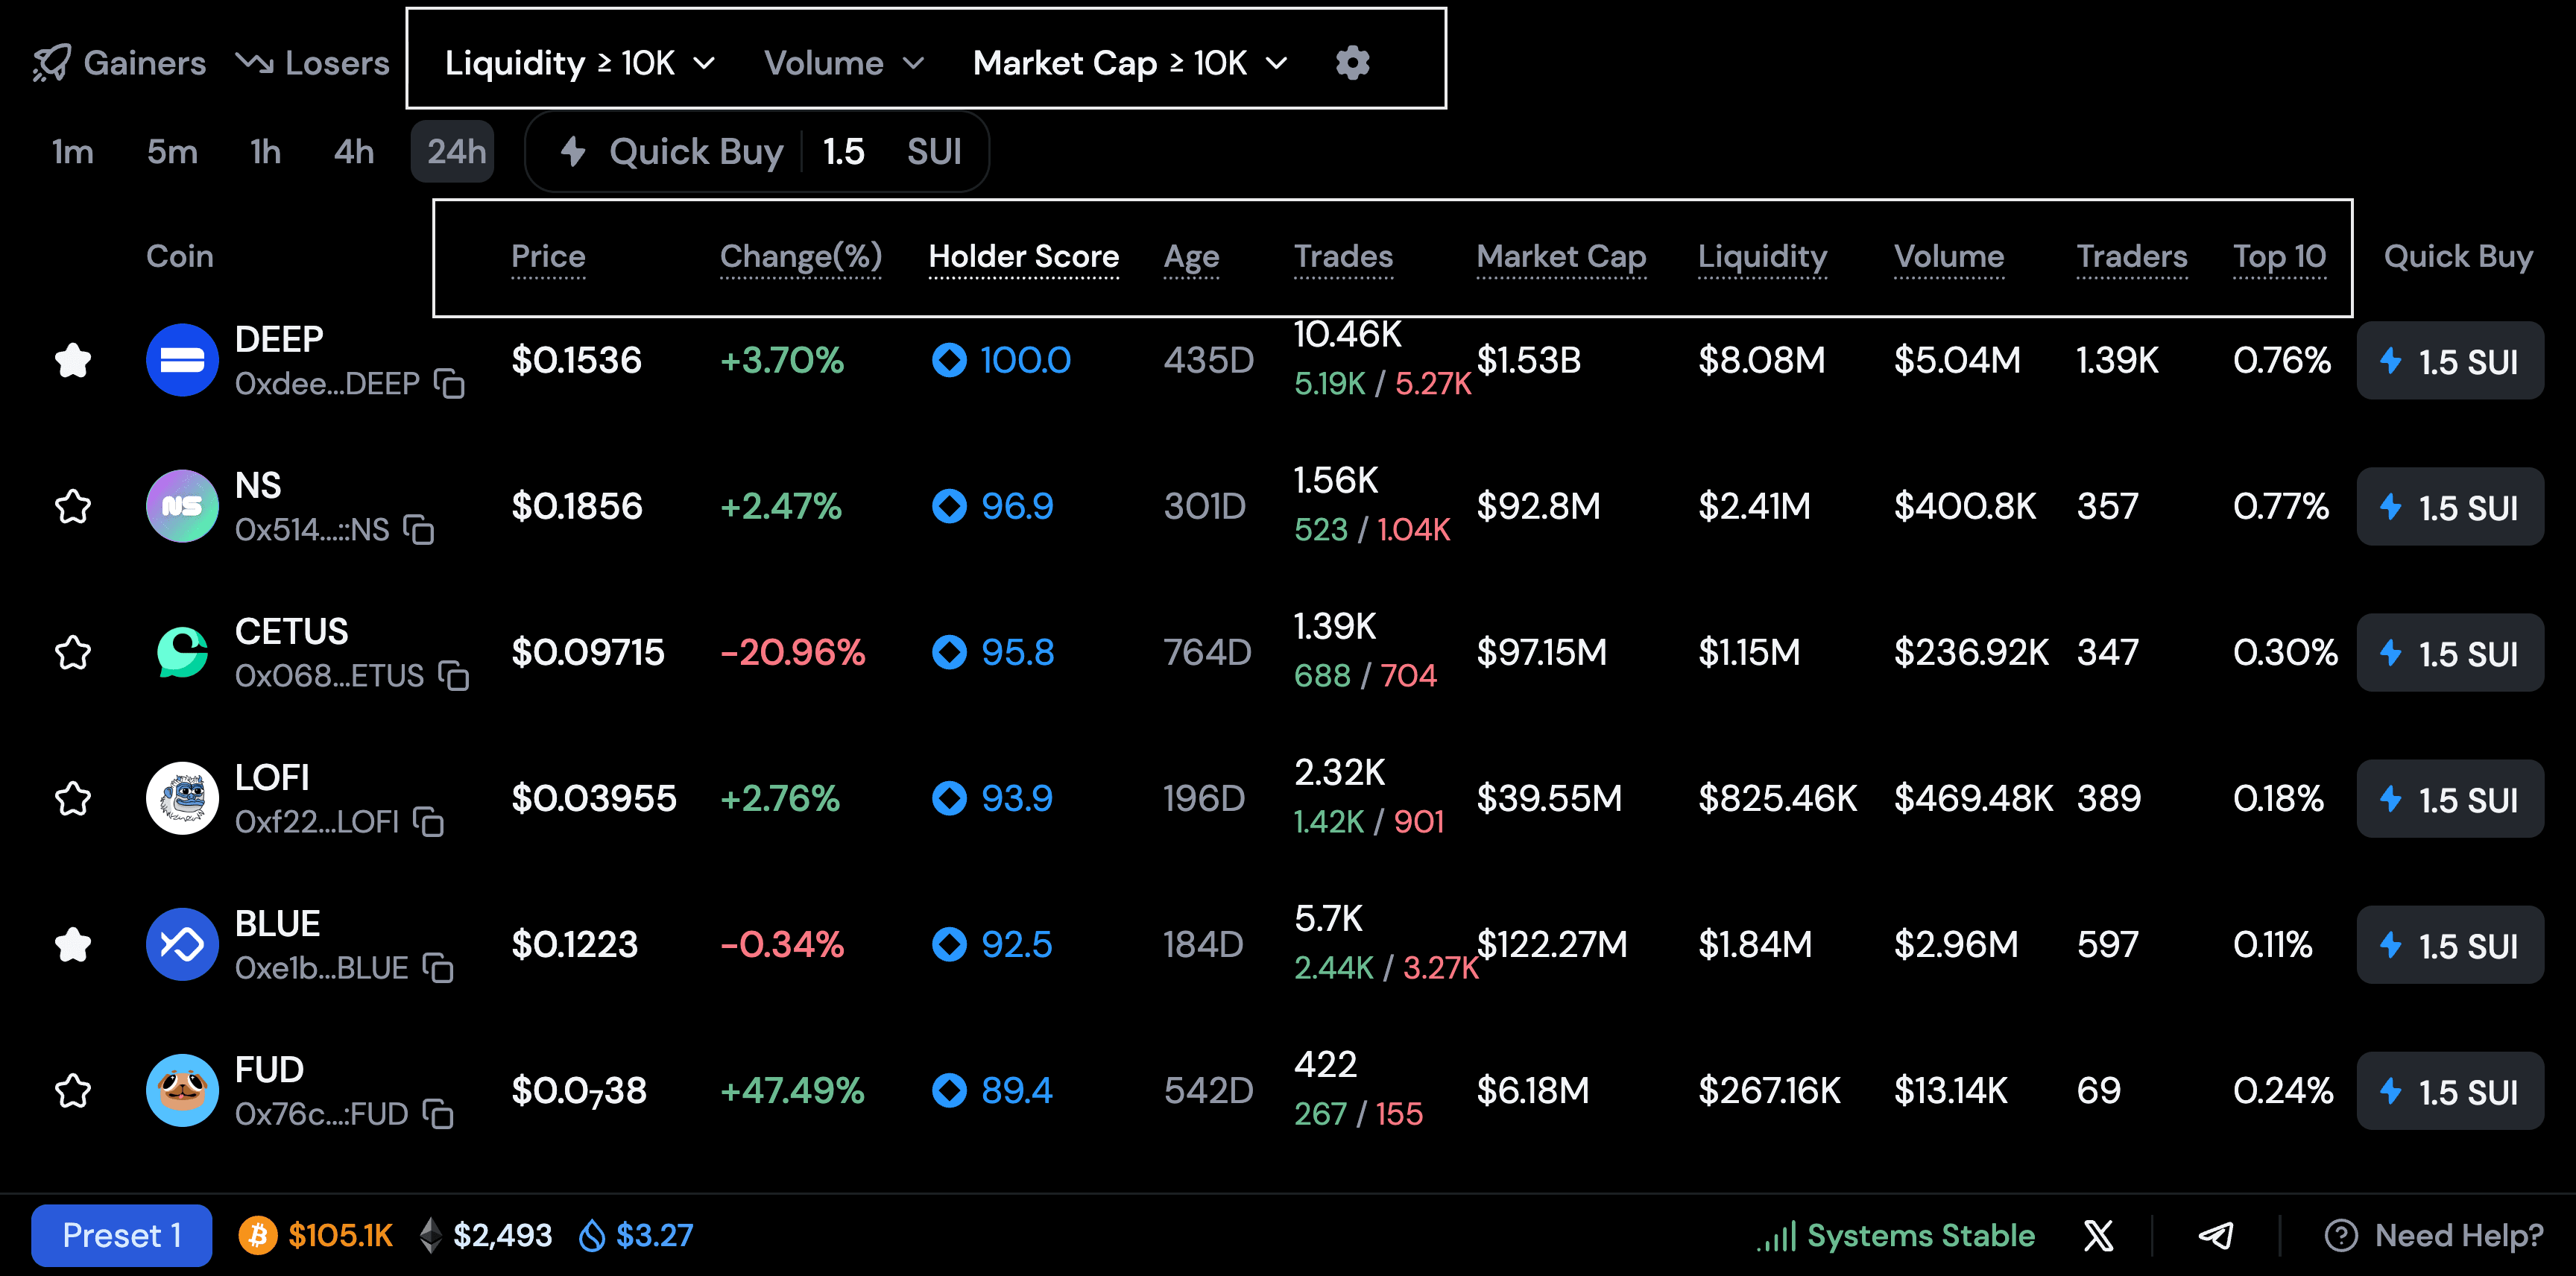
Quick Analytics with Filters
You can perform quick analytics with the filters and metrics on the coins dashboard. Use the Filters to narrrow down and find an entry and toogle the column name to order the data in any column.
Price Charts
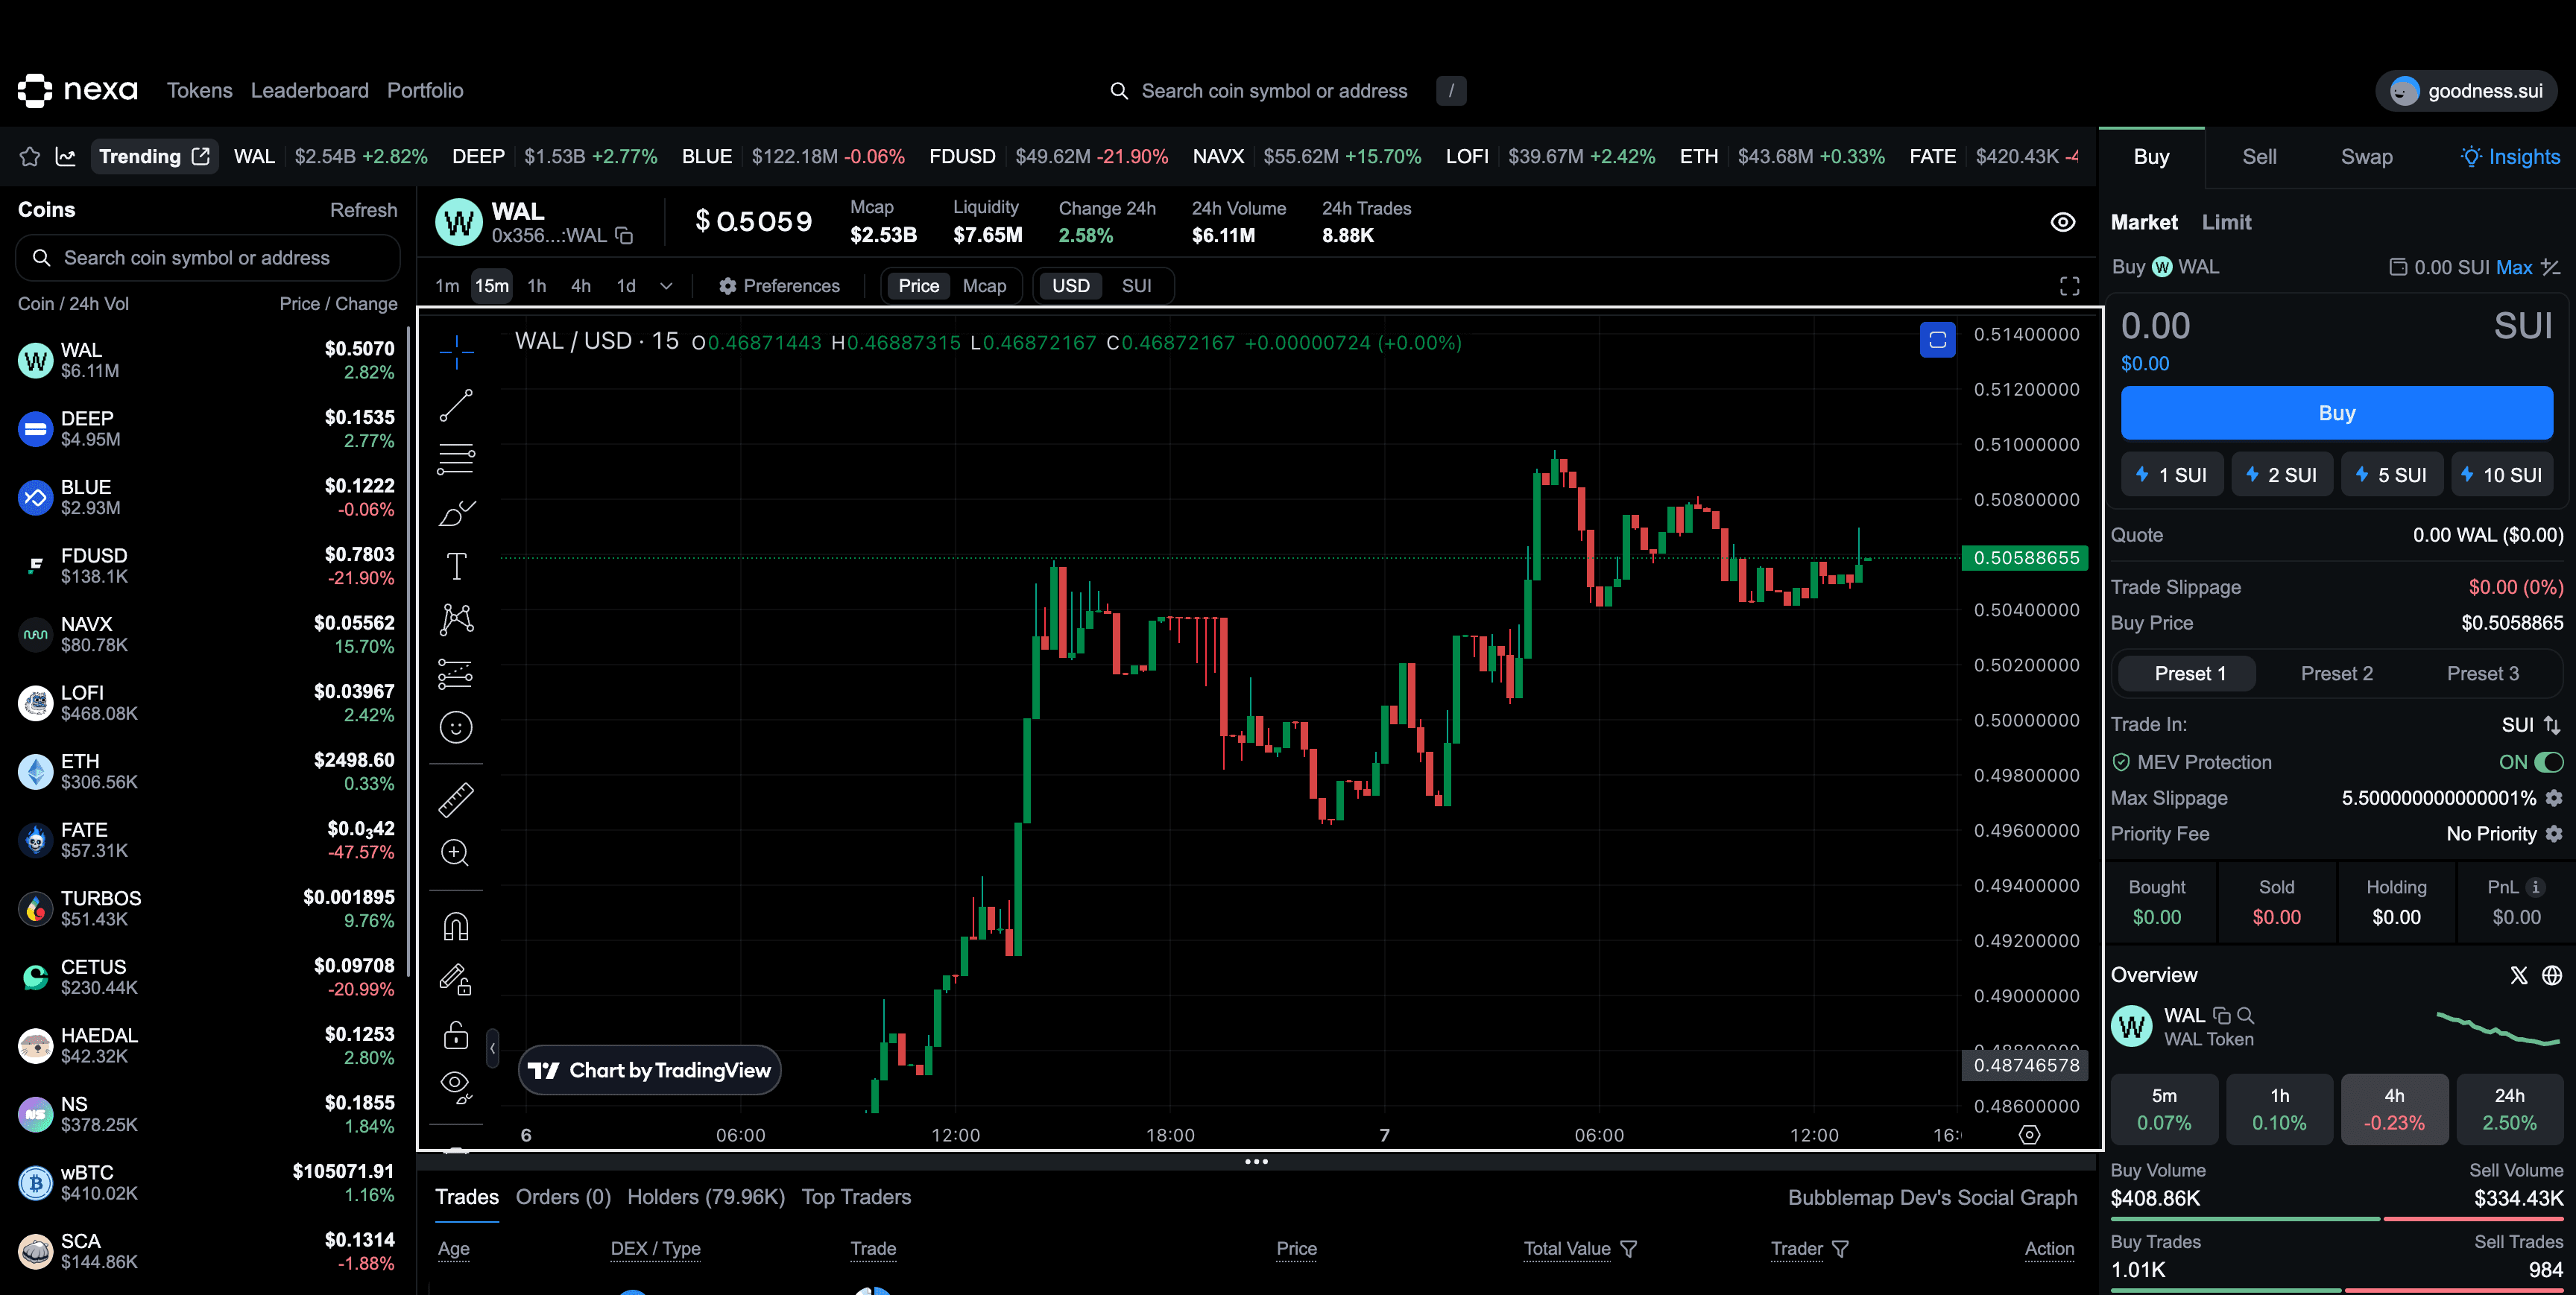
Our price charts are powered by TradingView, providing professional-grade charting capabilities:
- Real-time price and volume data with millisecond updates.
- Multiple timeframe analysis from 1-minute to monthly views.
- Over 100+ technical indicators and advanced drawing tools.
- Fully customizable chart layouts and user-defined settings.
BubbleMaps Integration
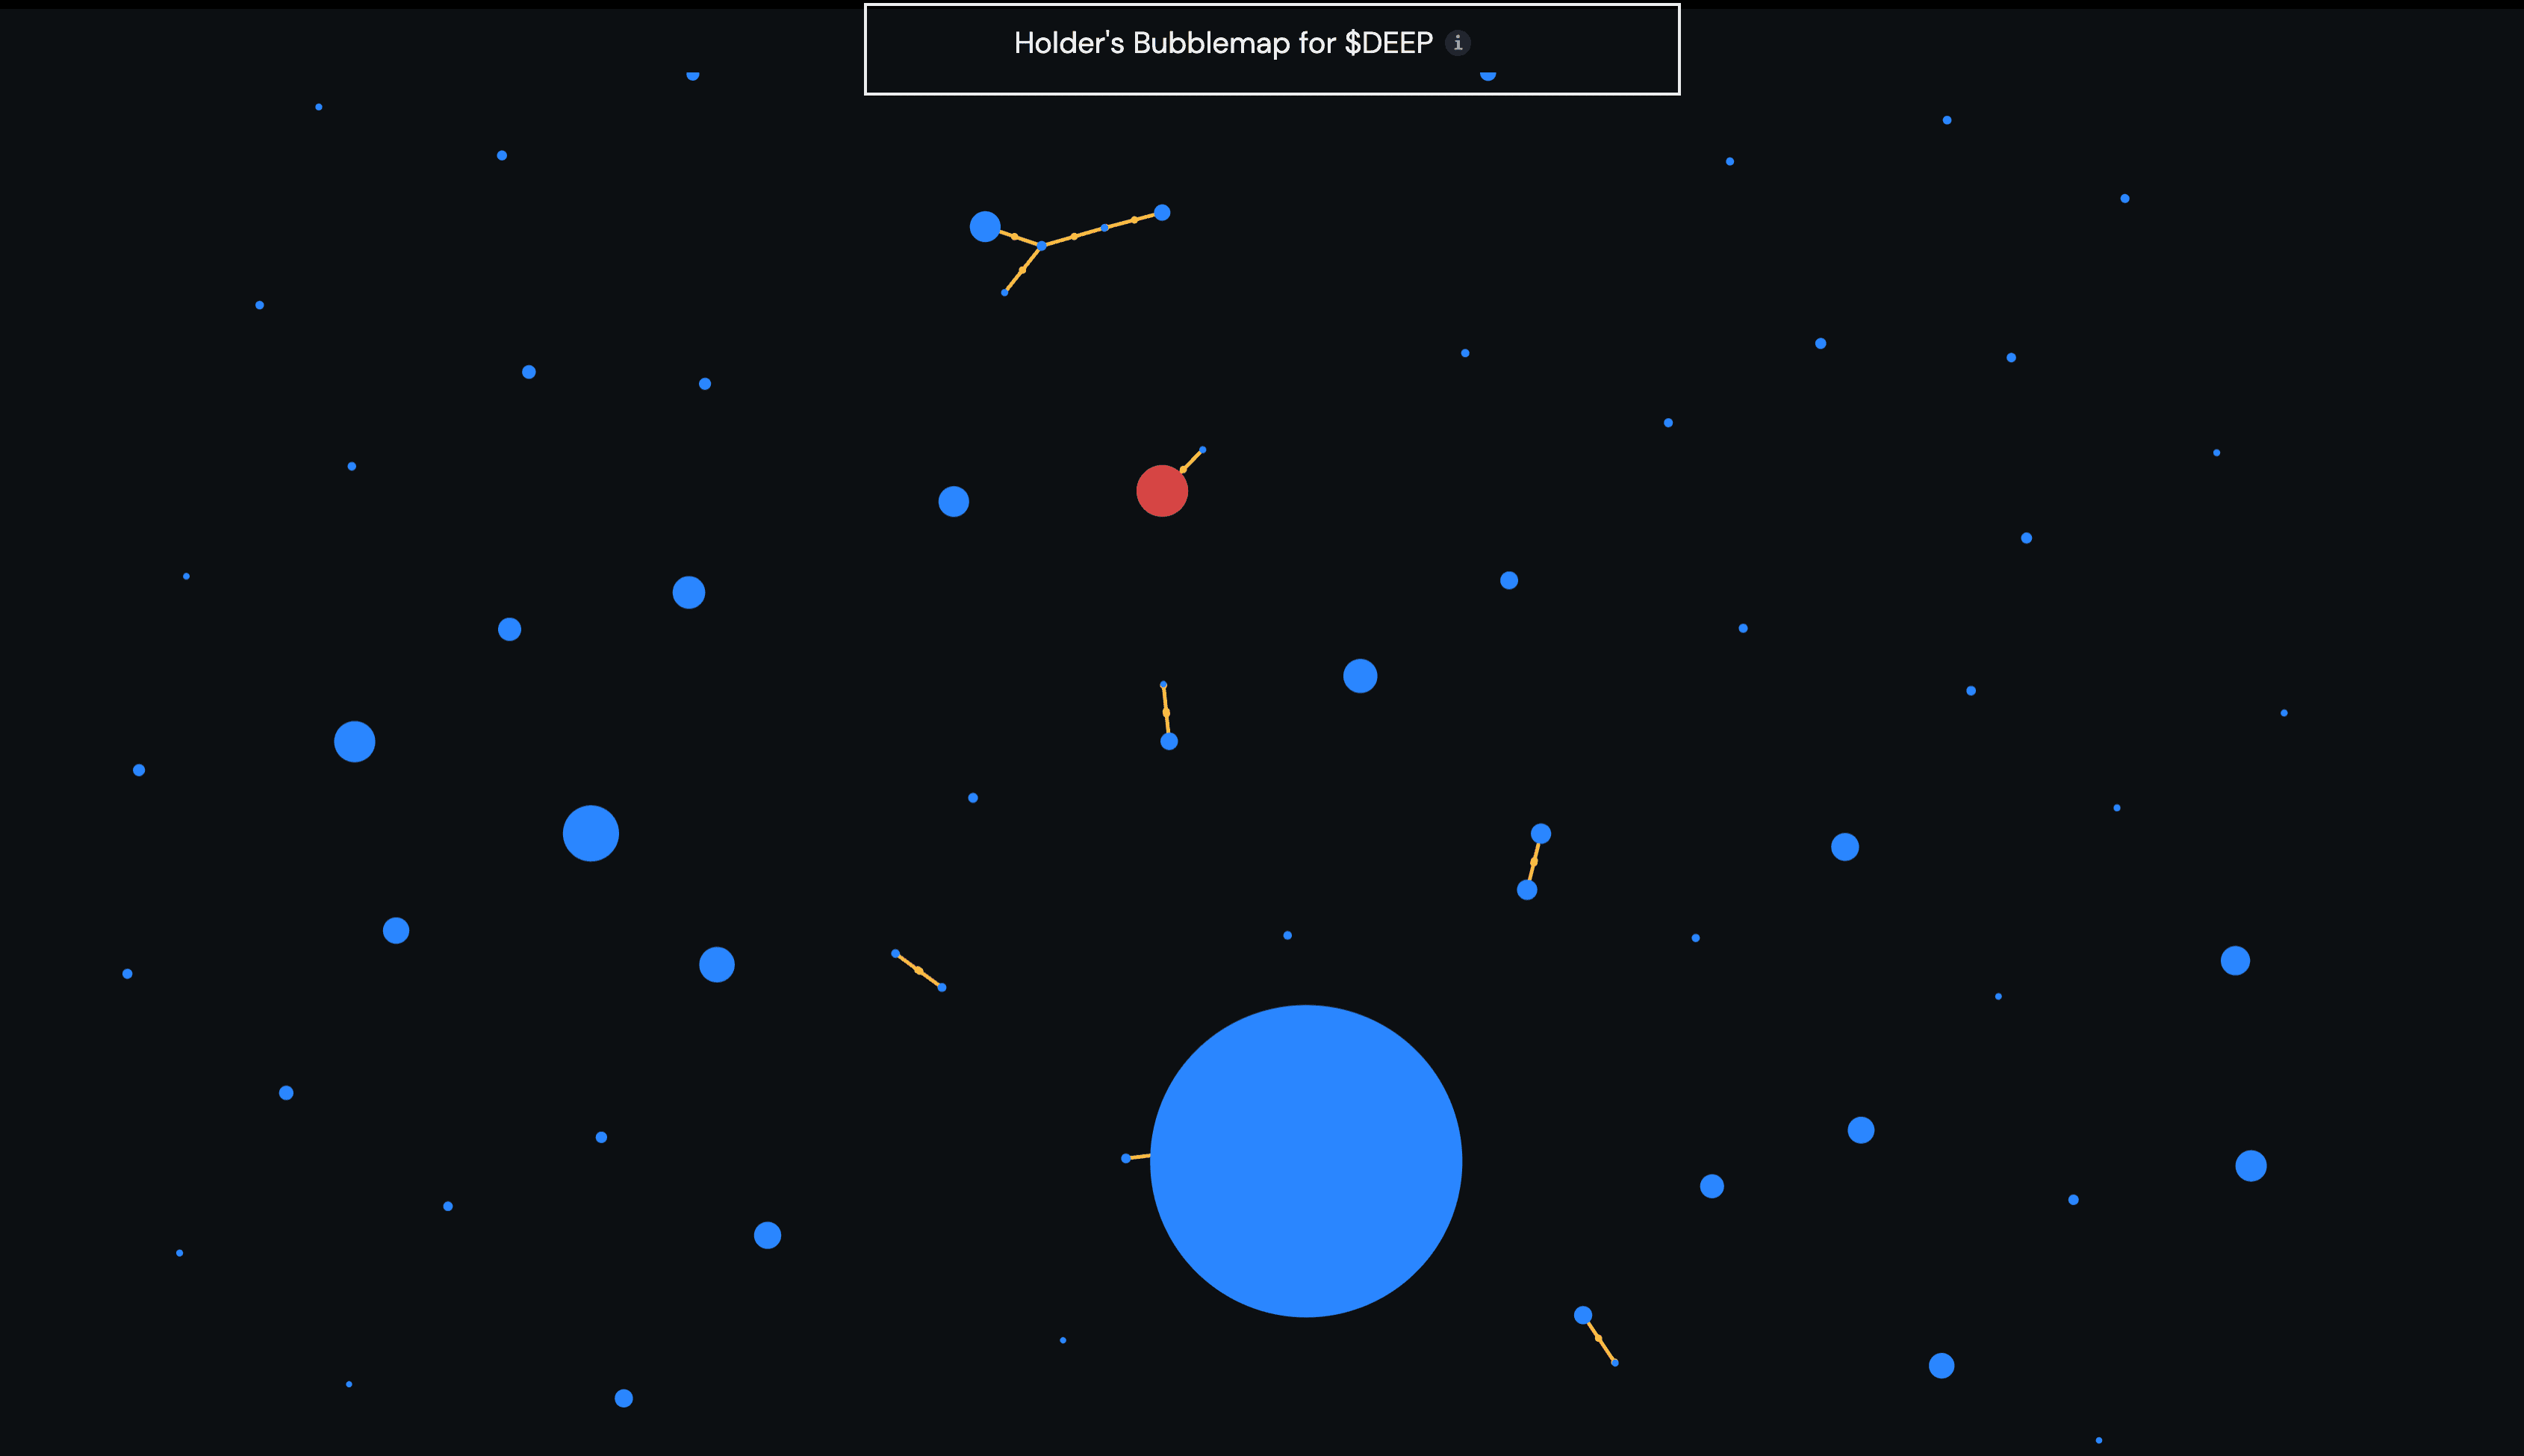
Our BubbleMaps integration offers deep insights into token holder relationships and transaction patterns including:
- Visual representation of holder networks.
- Token distribution analysis.
- Transaction flow tracking.
- Whale wallet identification.
Wallet Analytics
 Track and analyze wallet behavior with our comprehensive wallet analytics.
- Portfolio performance tracking
- Transaction history analysis
- Profit/loss calculations
- Trading pattern insights
You'll find this feature across all portfolios you visit on Nexa.
Transaction Table
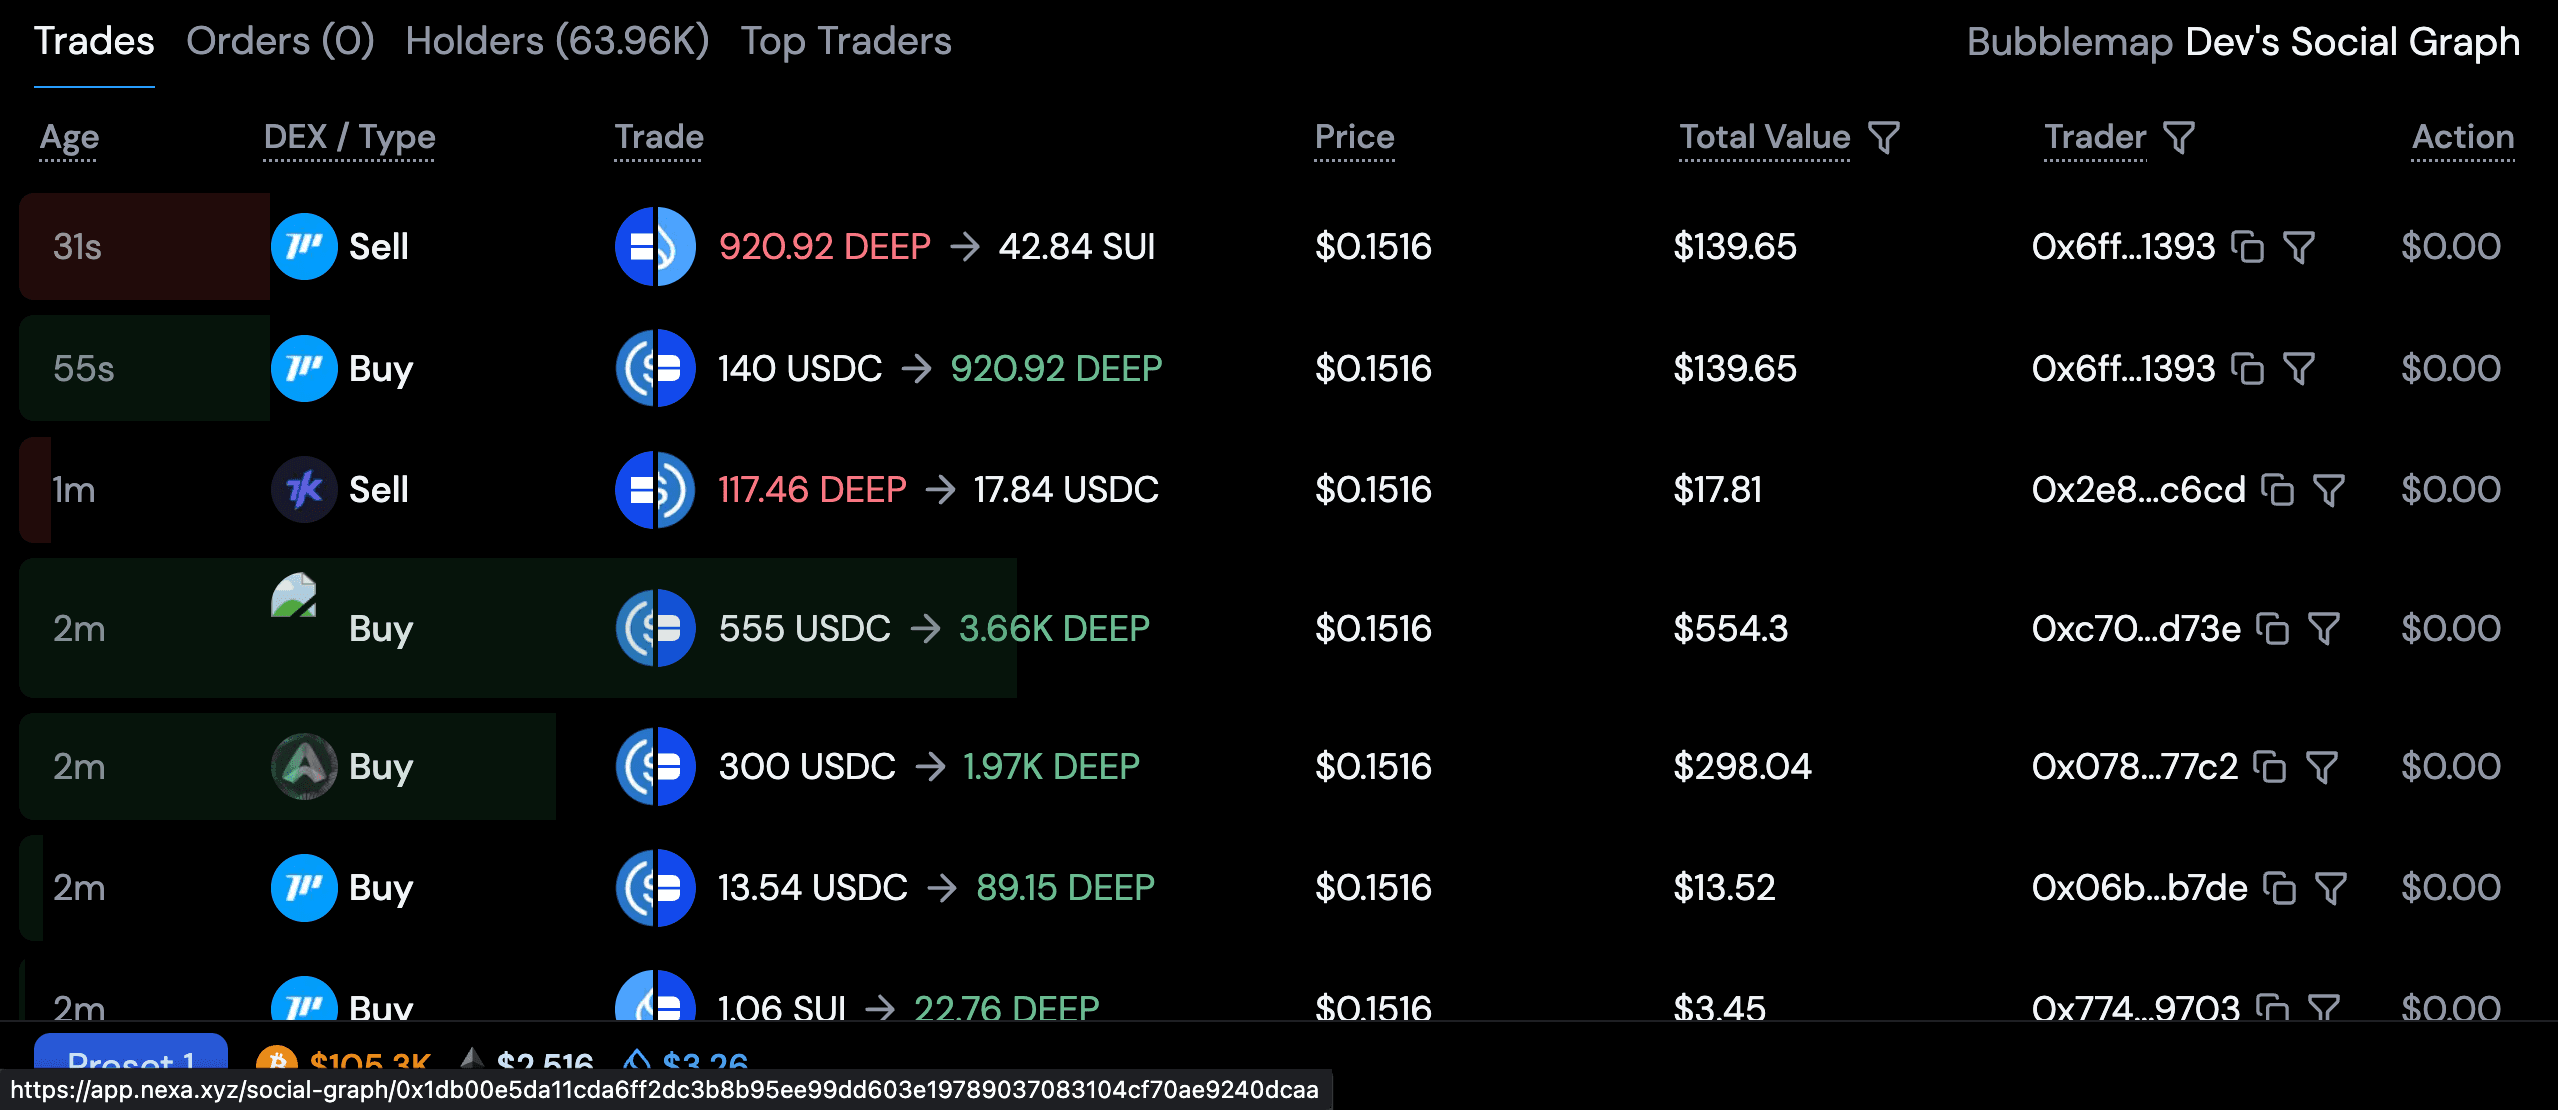
The transaction table provides a comprehensive view of all trading activity for any token on Nexa across all DEXs. Monitor trades in real-time with key information including:
- Real-time transaction feed - Watch trades as they happen with automatic updates
- Trade type and direction - See buy/sell flows with color-coded indicators
- Price and value per trade - Track transaction amounts in both tokens and USDC
- Trader wallet information - View trader addresses and their trading history
Click on any transaction to view detailed analytics, including trader profiles and complete transaction history.
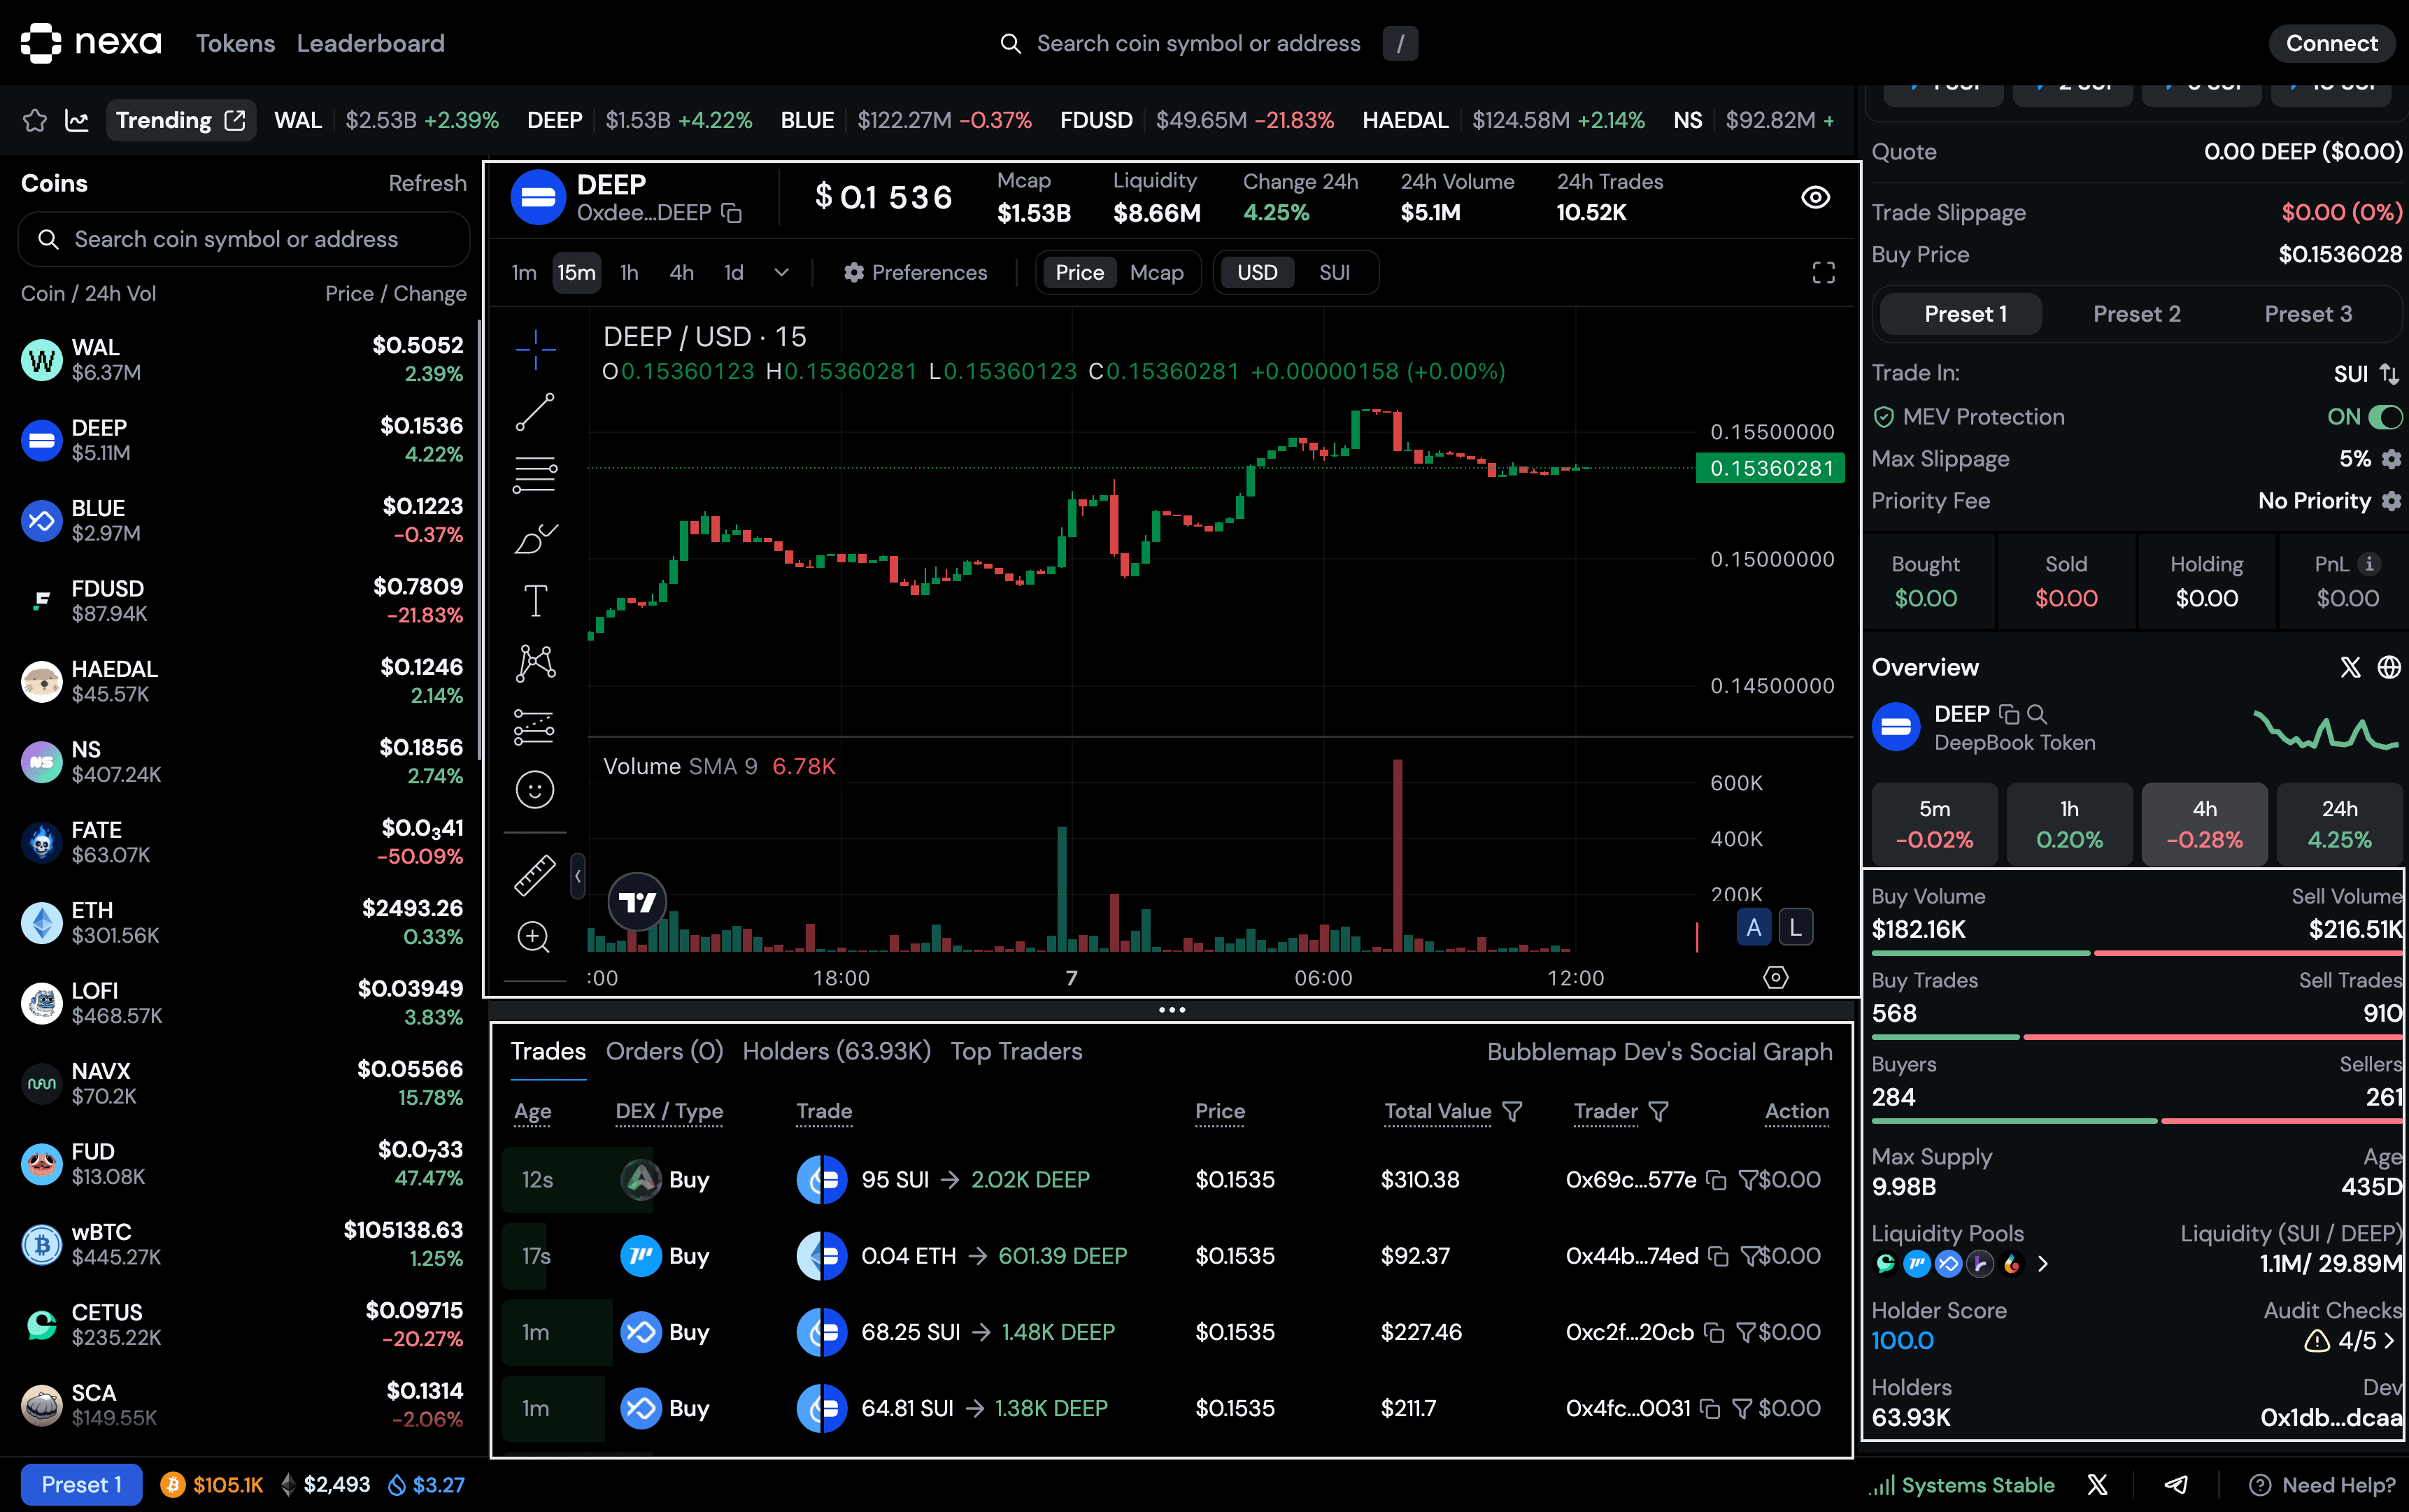
Coin Overview
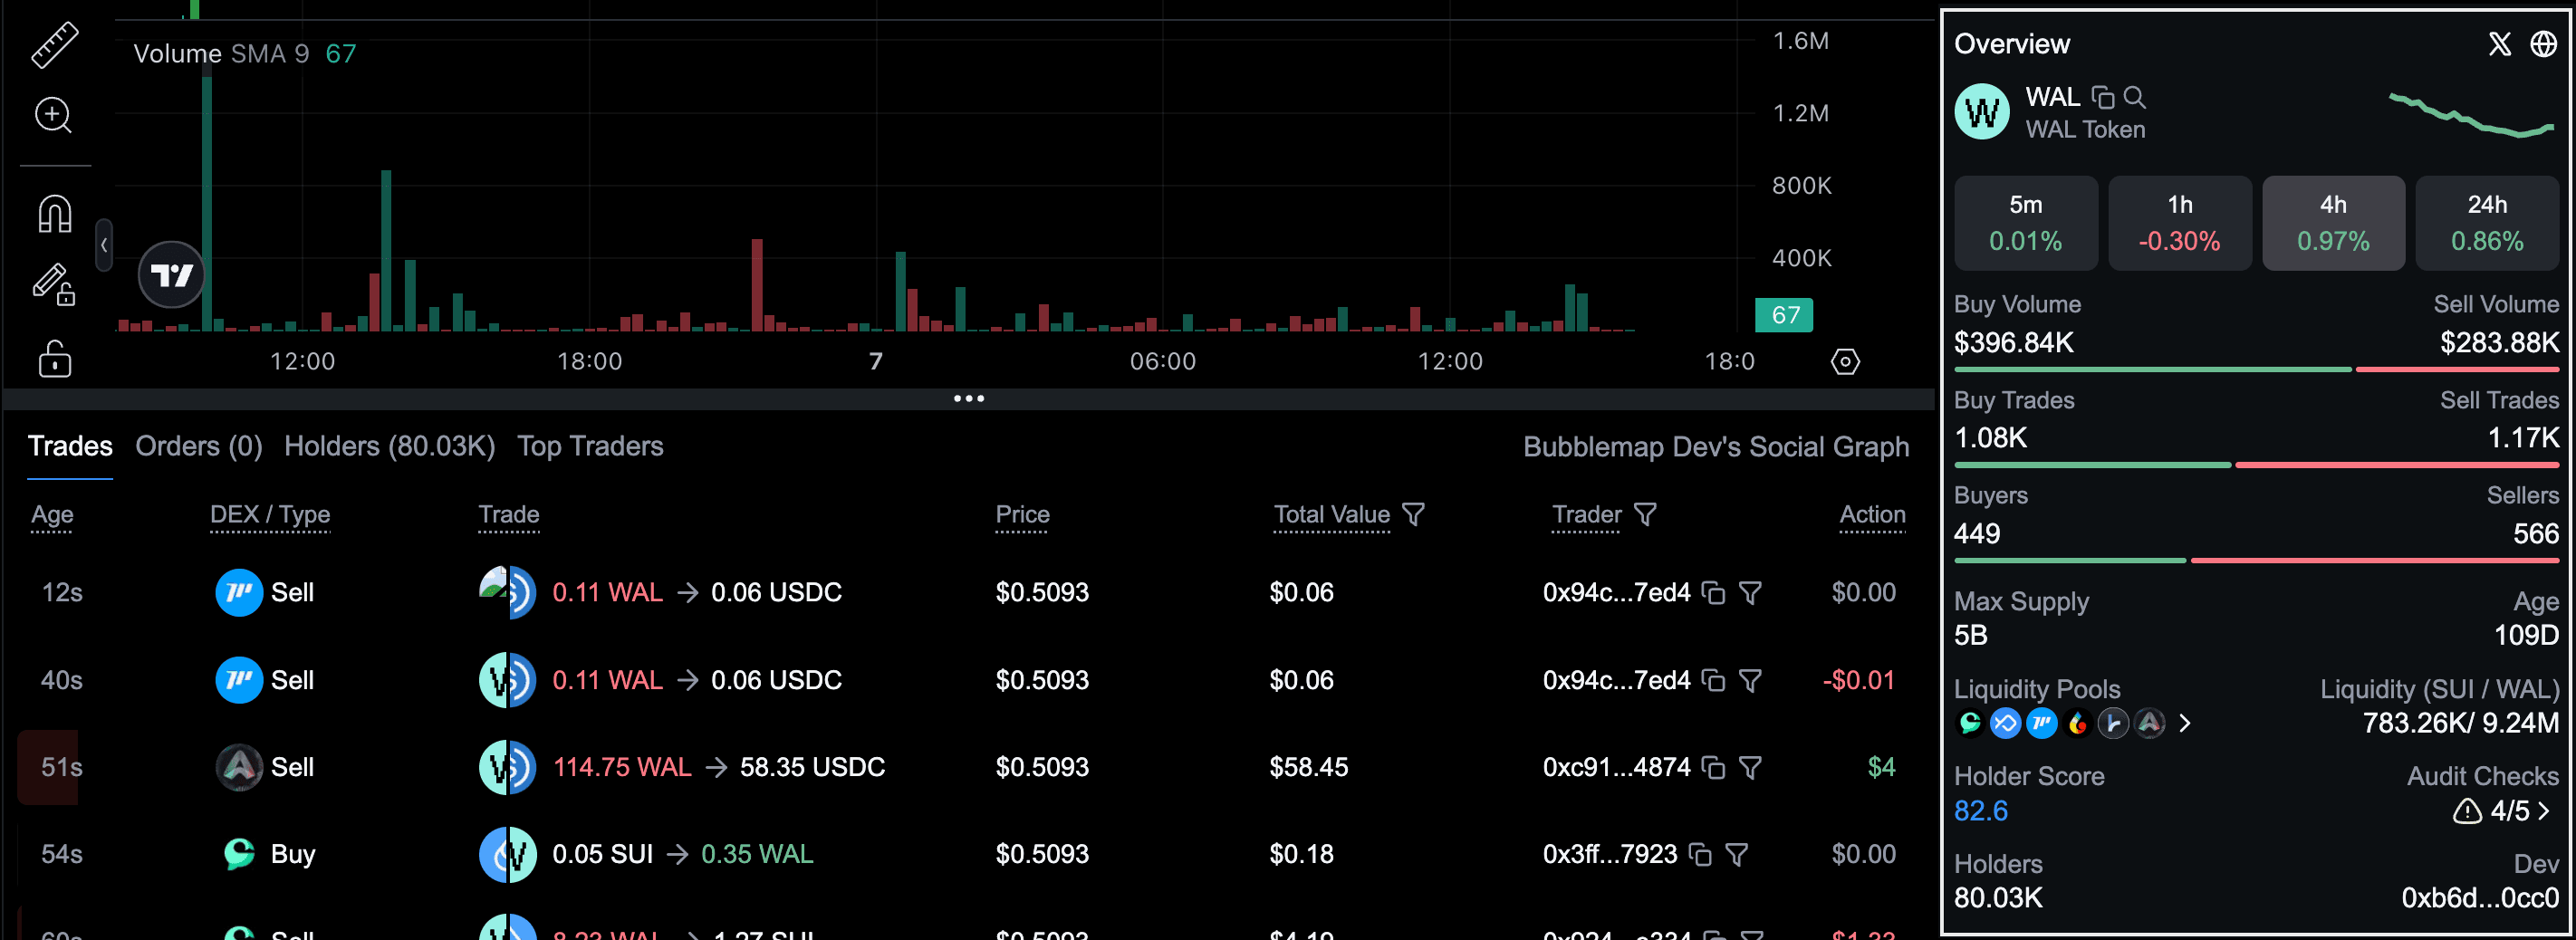
The Coin Overview provides a comprehensive trading interface with essential metrics and information:
- Price Performance - Track token price changes across multiple timeframes (5m, 1h, 4h, 24h) with percentage indicators
- Trading Volume - Monitor buy and sell volumes with detailed breakdowns
- Market Metrics - View number of buyers and sellers, maximum token supply, liquidity pool information, and holder count
- Key Indicators - Access holder score, audit status, and developer wallet information
The interface combines price charts, trading metrics, and market indicators in a single view for efficient market analysis.
Now, let's dive deeper into Nexa specific analytics tools and metrics. The ones that help you stay safe and possibly win trades.